The p-value, while it is one of the most widely-used and important concepts in statistics, is actually widely misunderstood.
Today we’ll talk about what it is, and how to obtain it.
(If you’re in a statistics class, or using this stuff out there in the real world, consider ordering “Statistics in Plain English” by Timothy Urdan. It’s got the readability of the Idiot’s Guide on the same subject, and (thank God) a non-textbook price, but without the glaring mistakes.)
Update: As I’ve been doing with my newer posts, I decided to put together a spreadsheet you can use to skip the dirty work. This spreadsheet calculates the p-value for Z-tests, t-tests (both single and two-sample), and proportion tests.
The P-Value: What it Really Means
The P-value is one of the biggest sources of confusion in statistics, and it’s not uncommon for researchers to use the wrong definition: not when they compute it, but when they think about it. So read this definition carefully:
The P-value is the probability that our data would be at least this inconsistent with the hypothesis, assuming the hypothesis is true.
This sounds simple enough, but it’s very tempting to interpret this in one of the following incorrect ways:
- “The probability that the hypothesis is true” – This one doesn’t mess me up too much, but it can be a source of confusion. It’s actually impossible to talk about the probability that a hypothesis is true using frequentist statistics. A high P-value means that our data is highly consistent with our hypothesis, nothing more.
- “The probability that the data is a fluke” – For me anyway, this is the interpretation that I really want to use, but it’s wrong. There are hidden assumptions here. What this really means, stated in full, is “the probability that our hypothesis is true and all deviations are explained by random error.” Again, it’s impossible to talk about the probability that a hypothesis is true using frequentist statistics. The P-value assumes some chance, so it can’t be used to evaluate chance.
- “The probability that we would reject the hypothesis incorrectly” – Nope. A low P-value encourages us to reject the hypothesis, but it doesn’t say anything about probabilities surrounding the hypothesis itself.
- “The probability that a repeat experiment would reach the same conclusion” – Wrong again.
- “The level of statistical significance” – This is another one that can be tempting for me personally, but it’s wrong. You choose your level of significance before you do the experiment. If the P-value satisfies your level of significance, then you say the experiment was conclusive.
- “The magnitude of the effect” – The p-value doesn’t say anything about how strong an effect is.
The Null and Alternative Hypotheses
Before we move on, it’s important to understand that you can’t use a high P-value to “accept” a hypothesis, even though this terminology is sometimes used. It’s better to say that you “failed to reject” the hypothesis.
In other words, when you’re dealing with P-values alone, your goal is always to reject a hypothesis. If you fail to reject a hypothesis, it means that your experiment is inconclusive. To accept a hypothesis, you need to understand the statistical power of a test, something we’re not going to get into today.
So, in order to say something useful, we need to choose a null hypothesis and an alternative hypothesis. The null hypothesis is typically the accepted status quo. The alternative hypothesis is usually the one we’re more interested in. When dealing with P-values alone, the alternative hypothesis needs to be the only possible alternative. That way, if we reject the null hypothesis, we can safely accept the alternative hypothesis, and state a conclusive result.
For example, let’s say we wanted to know if a new drug had an influence on IQ. These are what we would want to pick as our null and alternative hypotheses:
- Null hypothesis – The average IQ of a population that uses the drug will be the same as the average IQ of a population that does not use the drug.
- Alternative hypothesis – The average IQ of a population that uses the drug will be different from the average IQ of a population that does not use the drug.
These are the only two options, so if we reject the null hypothesis, we can accept the alternative hypothesis.
In order to reject the null hypothesis, we need to pick a level of statistical significance. By default, this is 5 or 1 percent. If we get a P-value smaller than our significance level, we can reject the null hypothesis.
Performing the Test
This is where things get muddy, and it’s why there’s really no predefined “formula” that will give you your P-value. The way you set up the test is going to depend on what your hypotheses are, and sometimes on how skewed your data is.
For the remainder of this article, we’re going to talk about some of the most common tests, how they work, and how you find the P-value. Let’s get started.
Z Test for a Population Mean
When to use the test: You want to test whether your sample average is statistically consistent with a hypothesized population average.
Conditions that must be met
- You have a randomly selected sample.
- The sample is significantly smaller that the population.
- The variable in question has a perfectly Normal distribution.
- We “know” the population standard deviation.
These conditions are unrealistic under most circumstances. The z test is mostly used to introduce students to statistical testing and is rarely used elsewhere.
Performing the test
You’ll need the following data in order to perform a z test:

Then you will calculate something called the one-sample z test statistic, like this:![]()
The z statistic is simply the number of standard deviations you are from your hypothesized mean. Plug this into a table or statistical software in order to get the P-value. Don’t do this haphazardly, though. Keep your null and alternative hypothesis in mind.
Suppose, for example, we were testing whether a drug impacted IQ. We might choose the following as our hypotheses:
Null hypothesis: The population mean IQ of those who take the drug is 100.
Alternative hypothesis: The population mean IQ of those who take the drug is not 100.
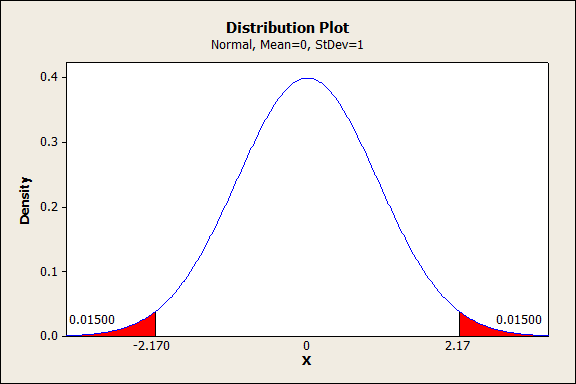
Now let’s say our z statistic was 2.17. To find the P-value, in this case, we would want to find the probability that we would get a z statistic of at least positive or negative 2.17 if the null hypothesis is true. The z statistic assumes a normal probability distribution, so we would find the P-value like this:

The area in red is 0.015 + 0.015 = 0.030, 3 percent. If we had chosen a significance level of 5 percent, this would mean that we had achieved statistical significance. We would reject the null hypothesis in favor of the alternative hypothesis.
We would conclude that we had evidence that the drug caused the average IQ to deviate from 100 IQ points.
As an aside, suppose we had chosen a different alternative hypothesis:
Alternative hypothesis: The population mean IQ of those who take the drug is higher than 100.
In this case, the P-value would be 1.5 percent, not 3 percent, and our evidence would be stronger.
The One-Sample t Test for a Population Mean
When to use the test: You want to test whether your data is consistent with a hypothesized population average, under the more realistic situation where you don’t know the population standard deviation.
Conditions that must be met
- You have a randomly selected sample.
- The sample is significantly smaller than the population.
- If the sample size is under 15, t tests are only safe if the data shows no strong departures from the Normal distribution.
- If the sample size is over 15, t tests are only safe if there are no outliers and there is no strong skewness.
- If the sample size is over 40, t tests tend to be safe even if the data is strongly skewed.
These conditions are just rules of thumb and don’t necessarily apply everywhere.
Performing the test
The t test for a population mean is very similar to the z test, except that you don’t need to know the population standard deviation. You only need to know the sample standard deviation, which is usually called s. Now, instead of calculated the z statistic, you calculate the t statistic, like this:![]()
The t statistic has the same basic meaning as the z statistic, and most other standardized statistics. It is the number of standard deviations your sample average is from the hypothesized mean.
However, the t statistic does not have a Normal distribution. The distribution is called (thankfully) the t distribution. It looks very similar to the Normal distribution, but it is “heavier in the tails.” In other words, you need to get farther away from the center of the distribution before your P-values start to get small.
We approach this test pretty much the same way we approach the z test, except this time we need to know one additional thing: the number of degrees of freedom.
In the case of the t statistic, the number of degrees of freedom is just one less than the sample size: n-1. (This is because we have used our sample data twice, once to find the sample mean, and again to find the sample standard deviation.)
Once we know our t statistic and our degrees of freedom, we can just plug them into a table or statistical software.
Borrowing from the previous IQ example, suppose our t statistic was 2.170. Now let’s say we chose a significance level of 5 percent and these were our hypotheses:
Null hypothesis: The population mean IQ of those who take the drug is 100.
Alternative hypothesis: The population mean IQ of those who take the drug is higher than 100.
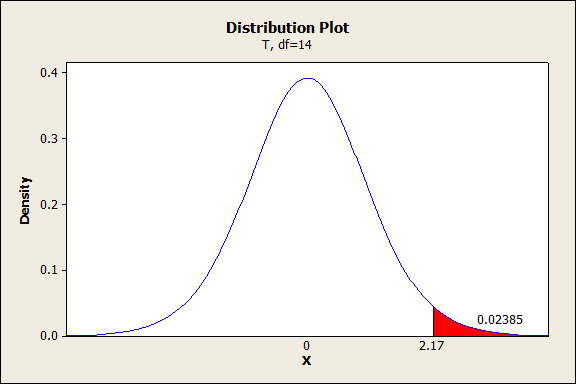
Now suppose our sample size was n=15. This means we would have 14 degrees of freedom, and our graph would look like this:
So our P-value is 2.385 percent. Note that this is higher that the 1.5 percent we had earlier for the same set of hypotheses. Still, even with a sample size of just 15, we have strong enough evidence to reject the null hypothesis at the 5 percent significance level.
To reiterate the meaning of the P-value, this result means there is only a 2.385 percent chance that our t statistic would be at least this high if the true population mean were 100 IQ points.
As an aside, note that if our alternative hypothesis had been that the IQ was lower than 100, the P-value would be 100-2.385=97.615 percent. This does not mean that we would accept the null hypothesis as true. It simply means that we wouldn’t be able to reject it.
The Matched Pair t Test
When to use the test: You gather two sets of data from the same set of subjects, and you want to test if there is a difference between the two sets of data. For example, you might treat the same set of patients twice: once with a placebo and once with an experimental drug. Your goal would be to see if the drug had different effects than the placebo.
Conditions that must be met
The conditions are the same as for the one-sample t test for a population mean, except for one additional condition. You need to randomly assign half of the subjects to one condition first, and randomly assign the other half to switched conditions. For example, one group would take the placebo first, and the other half would take the placebo second.
Performing the test
The t statistic that you calculate is exactly the same:
What has changed is the interpretation. In the two examples above, we were talking about means and standard deviations of IQ. In this example, we would be talking about means and standard deviations of IQ difference.
For example, we could calculate the IQ difference for each subject by subtracting their IQ while taking a placebo from their IQ while taking the new drug. If our sample average was positive, it would mean that, on average, our subjects had a higher IQ while they were taking the experimental drug than they had while taking the placebo.
In this case, we might choose these as our hypotheses:
Null hypothesis: The difference between IQ while the subjects were taking the drug and while the subjects were taking the placebo is 0. (The population average is 0).
Alternative hypothesis: The IQ of the subjects was higher while they were taking the drug than while they were taking the placebo. (The population average is greater than 0).
From here forward, the test looks exactly the same as the one discussed above.
The Two-Sample t Test
When to use the test: You are performing an experiment where you treat two samples differently, and want to determine whether the different treatments resulted in statistically significant different results.
Conditions that must be met
- You have two separate samples, and each of them were selected randomly.
- The samples are significantly smaller than the populations they represent.
- The distributions of the two samples are similar.
- If the total sample size is under 15, two sample t tests are safe if the data shows no strong departures from the Normal distribution.
- If the total sample size is over 15, two sample t tests are safe if there are no outliers and there is no strong skewness.
- If the total sample size is over 40, two sample t tests tend to be very safe even if the data is strongly skewed.
- Two sample t tests are most robust when the sample sizes are the same.
Again, these are rules of thumb and don’t always apply. In fact, two sample t tests are much more robust than one sample t tests, and can be quite accurate even with a total sample size of 10. Even so, these rules of thumb are good to follow if you want to be taken seriously.
Performing the test
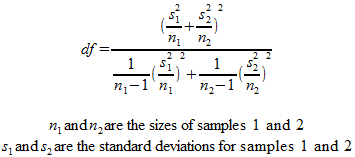
This test is a bit more complicated, in particular because the degrees of freedom are calculated from a much more complicated formula. Statistical software packages will handle this part for you under normal circumstances, but if you need to have the formula, here it is:

This is actually an approximation, but it’s accurate when each sample size is 5 or larger.
The t statistic itself isn’t too complicated, but it does look different:

From here forward you just use the t statistic and the degrees of freedom to find your P-value from a table or software, as discussed above. The null hypothesis of this test is that both samples have the same population mean.
Significance Test for a Proportion
When to use the test: You want to test whether your data is consistent with a hypothesized proportion, instead of a mean. In this case, you need to be measuring something that is either/or. For example, you might want to test whether more than 50 percent of people taking a prescription drug have an IQ higher than 100. You either have an IQ over 100 or you don’t.
Conditions that must be met
- You have a randomly collected sample.
- Your sample is significantly smaller than the population.
- The sample size is large enough that the distribution of your proportion estimate is close to Normal. As a rule of thumb, this means that your sample size multiplied by your proportion estimate is greater than ten, and that your sample size multiplied by the opposite of your proportion estimate is also greater than ten.
Performing the test
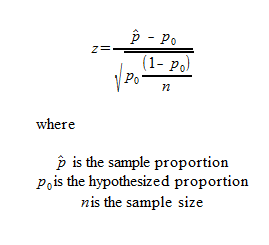
The formula for testing a proportion is based on the z statistic. We don’t need to use the t distribution in this case, because we don’t need a standard deviation to do the test. Here is the formula:

Unfortunately, the proportion test often yields inaccurate results when the proportion is small. Again, if you follow these rules of thumb this isn’t typically a problem:
![]()
However, another experimentally verified solution is to make this substitution:

which results in more accurate results under most circumstances. This is called, un-creatively, the “plus 4″ method.
As usual, once you have the z statistic, you can easily find your P-value in a table or by plugging it into statistical software. As always, pay attention to your alternative hypothesis (less than, greater than, or not equal to), or you could end up with a P-value that is off by a factor of 2.
The null hypothesis for this test is that the sample proportion comes from the hypothesized proportion.
Significance Test for Comparing Proportions
When to use the test: You are performing an experiment and want to test whether two sample proportions come from the same population proportion, much like the two-sample t test, except with proportions.
Conditions that must be met
The conditions are essentially the same as for the single sample proportion test.
- You have two separate samples, and each of them were selected randomly.
- The samples are significantly smaller than the populations they represent.
- Both samples have a number of “successes” and “failures” less than 10 (the same restriction as in the previous test, except for each sample).
Performing the test
Again, the formula for the test is based on the z statistic, but it takes on a different form since it involves two samples:

The null hypothesis for this test is that both sample proportions come from the same population proportion. If you understand the previous tests, it should be fairly straightforward what to do with the z statistic that comes out.
For a more accurate result, you can again use the “plus four” method discussed in the previous test. In this case, just add one success and one failure to each sample proportion, and increase each sample size by 2.
Conclusion
This is by no means an exhaustive list of the statistical tests available to find P-values, but it should give you an idea of how to think about the subject. If you need more, pick up that book I told you about earlier. Or go ahead and download that spreadsheet by signing up for updates below:
Thanks.
Learn how to do statistics easily in Excel